


Create SEO Reports That Actually Drive Results
Sections
Let’s be real - handing a client a stack of charts and a jumble of numbers isn’t reporting. It’s just noise. A truly great SEO report does something more. It tells a story, connecting all your hard work to the results that actually matter to their business.
This is your chance to move beyond basic metrics and show them exactly how your efforts are justifying their investment and pushing them forward.
#Why Your SEO Reports Are More Than Just Data
Think of your report as the main tool you have to communicate your value. It’s where you transform all that complex SEO data into a clear narrative - one that talks about progress, highlights challenges, and lays out the strategic path ahead. It solidifies your role as a partner, not just a service provider.
The whole point is to demonstrate tangible business impact. It’s how you draw a straight line from link building or content optimization to what your client actually cares about. We’re talking leads, sales, and real return on investment (ROI).
#From Data Points to Strategic Wins
Your report needs to showcase strategic wins, not just data points. For example, instead of just pointing out a jump in keyword rankings, explain how ranking for a few key high-intent phrases led to a 25% increase in qualified leads from their main service page.
See the difference? You’ve just reframed the conversation from technical jargon to genuine business growth.
This shift in perspective is what proves your worth. When you build reports that speak the language of business, you become an indispensable part of their team. Your report should directly answer questions like:
-
How did our SEO work contribute to revenue this month?
-
Which specific pieces of content are bringing in our ideal customers?
-
Based on this data, what are the next moves we should make to keep the momentum going?
A great report doesn’t just present what happened; it explains why it happened and what we should do next. It bridges the gap between SEO metrics and business success, making your role clear and your value undeniable.
To help you structure this narrative, let’s look at the core components every report should have. These elements work together to tell a complete and compelling story of your SEO campaign’s performance and strategic value.
#Core Components of a High-Impact SEO Report
| Component | What It Demonstrates | Why It's Crucial for Clients |
|---|---|---|
| **Executive Summary** | The high-level story of performance, wins, and next steps. | Gives busy stakeholders a quick, clear overview of the bottom-line impact. |
| **Organic Traffic Growth** | An increase in overall visibility and brand reach. | Shows that more potential customers are finding their website through search. |
| **Keyword Rankings** | Progress for commercially valuable and informational keywords. | Proves you are capturing relevant search intent and beating competitors. |
| **Conversion Metrics** | Leads, sales, or other goal completions from organic search. | Directly connects SEO efforts to tangible business outcomes and ROI. |
| **Top Performing Content** | Which pages or posts are driving the most traffic and conversions. | Provides insights into what resonates with their audience and informs future content strategy. |
| **Action Plan & Outlook** | A clear outline of the strategic priorities for the next period. | Sets expectations and shows you are proactively driving the strategy forward. |
Wrapping these components together transforms a simple data dump into a strategic document. It provides clients with the clarity and confidence they need to understand the value you’re delivering.
#Justifying Investment with Clear Impact
Ultimately, your report is the proof that justifies your client’s investment in SEO. And the data is on your side. In a survey of over 350 marketing professionals, a massive 91% saw a positive impact from SEO on their marketing goals.
On top of that, organic search drives an average of 33% of all website traffic across major industries, cementing its role as a vital and consistent source of potential customers. You can explore more data on organic marketing’s impact to see just how essential it is.
When you frame your results against this industry-wide success, you’re not just showing numbers on a page. You’re proving their investment is paying off in a powerful, validated way.
#Gathering the Data That Tells the Right Story

The secret to a report that clients actually care about isn’t just dumping a bunch of data on them. It’s about telling a compelling story with the right data. To do this, you have to look past the easy, flashy numbers and dig into the metrics that truly connect to real-world business goals. That all starts with pulling information from the right places.
Your two best friends here are going to be Google Search Console (GSC) and Google Analytics (GA4). GSC gives you the raw, unfiltered truth of how Google sees your website - think clicks, impressions, and what people are actually typing to find you. On the other hand, GA4 picks up the story once they land on your site, showing you what they do next.
Making sure these two platforms are talking to each other is a non-negotiable first move. It’s how you build a bridge from what happens before the click (your visibility in search) to what happens after the click (how users engage with your site). This is what gives you the full, panoramic view of your SEO impact.
#Pinpointing Your Most Vital Metrics
Okay, you’ve got your data sources hooked up. The next big challenge is resisting the urge to report on everything. Drowning a client in charts is a fast track to getting your reports ignored. Instead, you need to zero in on the key performance indicators (KPIs) that directly line up with what the campaign is trying to achieve.
For example, a big traffic number looks nice, but showing growth in organic traffic from non-branded keywords is so much more powerful. Why? Because it proves your strategy is pulling in a fresh audience that didn’t already know the brand name. That’s a crystal-clear sign of expanding your market reach.
The same goes for keyword rankings. Sure, tracking them is standard, but focusing on high-intent keywords tells a much richer story. These are the search terms people use when they’re close to opening their wallets or filling out a contact form. When you show rankings for those terms are on the rise, you’re drawing a direct line from your work to potential revenue.
Forget about chasing a high backlink count. The quality of your backlink profile will always trump quantity. One solid link from a respected, relevant site is worth a hundred low-grade links and sends a far stronger signal to search engines.
#Essential Data to Extract for Your Report
To build a report that has real credibility, you need to pull specific, actionable data points. Don’t just screenshot the default dashboards; get your hands dirty and dig into the reports to find the narrative.
Here are the core metrics you should always prioritize:
-
Organic Traffic & Sessions: This is your baseline. Track the total number of visitors coming from search engines to measure overall campaign growth.
-
Keyword Visibility & Position Changes: Keep a close eye on your main target keywords. Make a big deal out of any keywords that crack the top 10, since this is where over 75% of all clicks happen.
-
Click-Through Rate (CTR): Pulled straight from GSC, this metric tells you how persuasive your search snippets are. A climbing CTR means your page titles and meta descriptions are doing their job and grabbing attention.
-
User Engagement Signals: Head over to GA4 for metrics like engagement rate and average engagement time. These are your proof that the traffic you’re driving is high-quality and that people are actually finding your content useful.
-
Organic Conversions: This is the ultimate proof that your SEO is working. Track goal completions - like form fills, downloads, or sales - that came directly from organic search.
By curating your data around this set of metrics, you make sure every number serves a purpose. It helps you craft SEO reports that don’t just inform but actually persuade, justifying your strategy and proving your value. If you want to get more advanced, check out our guide on how to use Google Search Console for some extra tips.
#How to Build Reports with Reporting Tools
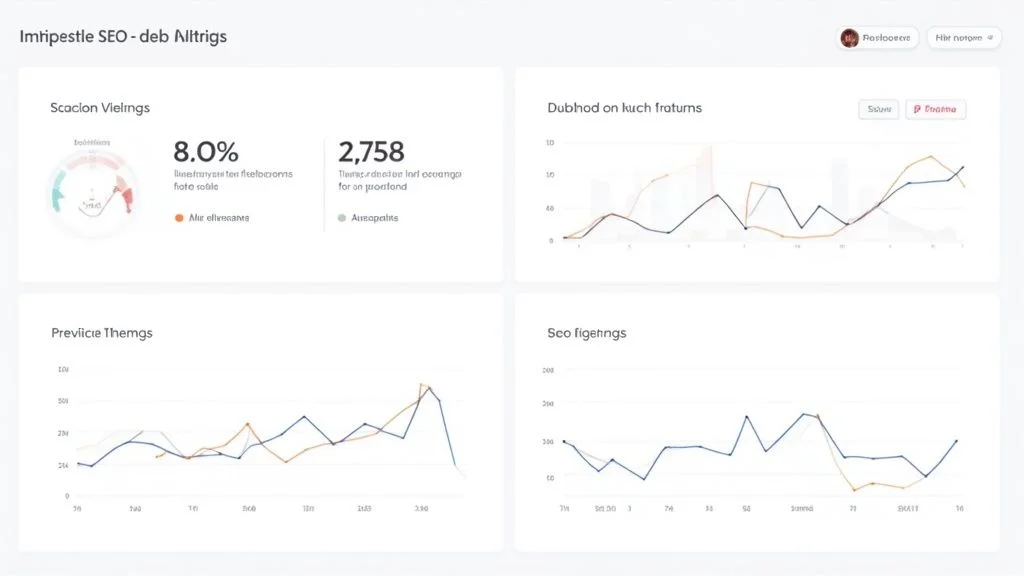
Alright, you’ve got your data sources hooked up and the numbers are flowing in. Now, it’s time to graduate from clumsy, manual spreadsheets to building sleek, efficient reports. This is where a dedicated reporting tool like Rankdigger really shines, letting you weave all that raw data into a story that actually means something.
Think of it as your command center. It pulls everything together - site audit results, keyword rankings, even your Google Analytics traffic - into one clean, customizable document.
The biggest win here is saving time and maintaining a professional look. Instead of wrestling with screenshots and Excel files for hours, you can generate a killer report in minutes. That frees you up to do what you’re actually paid for: providing expert analysis and a clear path forward. The goal isn’t just to create SEO reports packed with data; it’s to create reports that clients can actually understand and get excited about.
#Setting Up Your First Report Template
Let’s walk through a real-world scenario. You’ve just landed a new client: a local bakery that’s finally taking its e-commerce store seriously. Your job is to boost their local search presence and, more importantly, drive online orders for their sourdough and cupcakes.
Your first move inside a tool like Rankdigger is to create a new project for the bakery’s website. From there, you’ll head over to the reporting section. Most good tools come with pre-built templates, and honestly, they’re the best place to start. You’ll see options like “Monthly SEO Report,” “Keyword Rankings Overview,” or “Technical Health Summary.”
For our bakery client, the “Monthly SEO Report” template is the perfect starting point. It already has the foundational blocks you need to cover the essentials of any solid SEO campaign.
Here’s what you’ll typically find in a standard template:
-
Executive Summary: A blank text box right at the top, waiting for your personalized overview and insights.
-
Keyword Rankings: A module to track progress on crucial terms like “best cupcakes near me” or “online cake delivery.”
-
Organic Traffic Overview: A widget that pipes in Google Analytics data, showing you things like sessions and user behavior.
-
Technical Website Audit: A simple health score that highlights any new technical gremlins that popped up over the last month.
-
Backlink Profile: A quick snapshot of new links gained and old ones lost.
The real magic of these tools is their modular, drag-and-drop design. You can pull in different “widgets” or data sections to build a report that perfectly matches your client’s needs. If a client is all about their blog, you can add a “Top Performing Pages” module. If they’re constantly looking over their shoulder, you can drop in a “Competitor Analysis” section.
#Customizing and Scheduling Your Report
Once the basic structure is in place, it’s time to make it yours. This is where you go from just presenting data to telling a story. First, the easy part: add your agency’s branding - logo, color scheme - to give it that polished, professional touch.
But more importantly, this is where you inject your own voice. A chart is just a chart until you explain why it matters. For our bakery client, you might add a small note under the keyword rankings graph: “We broke into the top 5 for ‘artisan sourdough delivery,’ which drove 15 new user sessions and 3 direct online orders this month.” See? You’ve just connected a simple ranking bump to a tangible business result.
After you’ve sprinkled in your analysis, the final touch is automation. You can set the report to automatically generate and email itself to the client on the first Monday of every month. This simple step builds immense trust through consistency and transparency, showing them you’re always on top of their campaign. It’s a streamlined process that helps you create SEO reports that are not only insightful but also impressively efficient.
#Translating Metrics into Actionable Insights

Let’s be honest, data is just a pile of numbers until you give it a story. This is where you stop being a data collector and become a true strategic partner. Your real value isn’t just in showing charts that go up and to the right; it’s explaining why they’re moving and what it actually means for the business.
When you create SEO reports, you’re connecting the dots for your client or your boss. A drop in bounce rate on a key service page isn’t just a number; it’s proof that the new content strategy is hitting home with the right audience.
This is how you turn abstract data into a compelling narrative of progress.
#Connecting KPIs to Business Goals
Every single metric in your report needs to tie directly back to a bigger business objective. A surge in non-branded keyword rankings? That’s not just an SEO win. It’s a clear signal of growing brand authority and expanding market presence. You’re reaching new customers who weren’t even looking for your brand by name - a powerful sign of top-of-funnel growth.
Think about a real-world scenario: a client’s mobile traffic suddenly tanks. Your analysis can’t just stop at reporting the drop. You have to dig into the why. Was it a new technical bug? A Google algorithm update that started favoring different kinds of pages? Or maybe a competitor just rolled out a killer mobile-first campaign?
Your job is to diagnose the problem and then lay out a clear, actionable game plan. Something like this:
-
Observation: Mobile traffic took a 15% hit month-over-month.
-
Diagnosis: This lines up perfectly with a recent Google update that prioritized mobile page experience. I’ve checked, and our core service pages are loading too slowly on phones.
-
Action Plan: We’ll prioritize optimizing the images and deferring non-essential scripts on those pages. The goal is to slash load times by at least two seconds.
This is the kind of proactive problem-solving that separates a basic report from a strategic tool that drives real decisions.
#Analyzing the Complete Performance Picture
To give truly valuable insights, you have to look past the surface-level metrics like traffic and rankings. You need to get the complete performance picture by digging into user behavior, conversion paths, and the actual quality of your traffic.
Remember, organic search is a beast - a staggering 94% of clicks go to organic results over paid ads. And with about 75% of searchers never venturing past the first page, those top rankings are everything.
This data really hammers home why a holistic view is so critical. Jump into Google Analytics and check out the user behavior flows. See what people are doing after they land on your site from a search. Are they exploring other important pages, or are they bouncing immediately?
When you analyze organic conversions, you’re not just counting form-fills. You’re proving the direct ROI of your SEO efforts. You’re showing exactly how a specific blog post or an optimized service page led to a real sale or a qualified lead. This is the most powerful story you can tell.
By weaving quantitative data together with this kind of qualitative analysis, you build a narrative that truly shows the impact of your campaigns. For a great framework on how to structure all this, check out our guide on creating a monthly SEO report template to help you organize your insights.
#Presenting Your Findings for Maximum Impact
How you present your data is just as critical as the data itself. Let’s be honest, a report packed with numbers but no story is just noise. The real goal is to turn your analysis into a clear story of progress - transforming a simple update into a strategic roadmap that guides your client’s next moves.
To create SEO reports that actually get read and make an impact, you have to focus on storytelling and clarity. Busy clients and stakeholders don’t have the time to decipher complex charts. Your job is to make the key takeaways immediately obvious, connecting your hard work directly to their bottom line.
#Crafting a Powerful Executive Summary
Every great report I’ve ever built starts with a punchy executive summary. This isn’t just a warm-up; it’s the entire report distilled into a few impactful sentences. Think of it as the elevator pitch for your month’s work.
This summary should immediately tackle three core questions:
-
What were our biggest wins this month?
-
What challenges or new opportunities did we find?
-
What’s our concrete action plan for next month?
By putting the most important information right at the top, you respect your client’s time and make sure they get the main points, even if they only skim the rest. This is your chance to frame the narrative and set a positive, forward-looking tone.
#Using Visualizations and Commentary
Raw data can feel intimidating. Use charts and graphs to make complex information easy to digest. For instance, a simple line graph showing organic traffic growth over six months is way more powerful than a clunky table of numbers. Tools like Rankdigger make generating these visuals a breeze.
But a visual without context is just a pretty picture. You have to add insightful commentary.
Your real value lies in the analysis you provide. Explain why a metric changed. A spike in traffic isn’t just a number; it might be the direct result of a specific blog post that took off or a successful link-building push.
This commentary is what turns you from a data-puller into a strategic advisor. When you’re discussing these metrics, it’s also vital to look at device-specific performance. Globally, a staggering 63.31% of web traffic now comes from mobile, yet only 11% of web pages rank identically on both desktop and mobile. That’s a huge gap! This disparity underscores the need for segmented analysis, especially since organic search drives 53.3% of all website traffic, making it the dominant channel. You can learn more about top SEO statistics on digitalsilk.com to get a better handle on these trends.
#Outlining Clear and Actionable Next Steps
A report should never just end with the data. The final - and arguably most important - part is your plan for what comes next. This shows you’re proactive and always thinking one step ahead.
Be specific and confident in your recommendations. Instead of a vague promise like, “We’ll work on content,” try this: “Next month, we will publish two new articles targeting the long-tail keywords X and Y. The goal is to capture more high-intent traffic for your core service.” This kind of clarity builds trust and sets clear expectations. If you need help defining your next moves with precision, you can also explore our article on key digital marketing performance metrics.
#Common SEO Reporting Questions Answered
Even when you have the best tools and solid intentions, questions always come up when it’s time to create SEO reports. Let’s run through a few of the most common ones I hear. Getting these right will help you fine-tune your process and show your true value.

One of the first things people ask is about timing. How often should you actually be sending these updates?
#How Often Should I Send SEO Reports?
For most clients and internal teams, a monthly reporting cadence is the sweet spot. This schedule gives your SEO efforts - like publishing new content or a link-building push - enough time to actually produce results you can measure. It’s the perfect balance, keeping everyone in the loop without drowning them in data.
A full month gives you a decent dataset to work with. You can spot real trends, identify new opportunities, and make smart adjustments to your strategy. Sure, a bi-weekly check-in might be handy during a huge campaign launch or a tricky website migration, but that full, comprehensive analysis is almost always best delivered monthly. It builds a reliable rhythm and trust.
#What Is the Most Important Metric in an SEO Report?
This is a tough one, because the “most important” metric really hinges on the campaign’s specific goals. But if you forced me to pick just one, it has to be organic conversions. While showing traffic growth and keyword rankings is great, nothing speaks louder than connecting your SEO work to real business outcomes.
Reporting on metrics like leads, sales, or demo sign-ups from organic search is the ultimate proof of value. It shifts the conversation from technical SEO jargon to bottom-line impact, making it the single most powerful metric you can show a client. It directly answers the “so what?” question.
Tracking conversions is how you demonstrate a clear return on investment (ROI). It’s the final piece of evidence that proves your strategy isn’t just about driving clicks - it’s about driving tangible business growth. This transforms your reports from a list of abstract numbers into a story of concrete success.
#How Can I Automate Reporting Without Losing the Personal Touch?
The trick here is to use a hybrid approach that blends efficiency with your own expertise. Use a great tool like Rankdigger or Google Data Studio to handle the grunt work - the data pulling and chart building. This step alone will save you hours of mind-numbing manual labor.
But the automation stops there. The crucial final step is to layer your human analysis on top before that report ever leaves your outbox. Always write a custom executive summary in your own words, explaining what the data actually means. I like to go a step further and annotate key charts to point out what a specific trend signifies or why a certain number is important.
Finally, wrap it up with specific, forward-looking recommendations based on what you found. This method saves you from the tedious tasks while making sure the report delivers the strategic value that only you, the expert, can provide.
Ready to stop wrestling with spreadsheets and start creating impressive, insightful reports in minutes? Rankdigger pulls all your crucial SEO data into one place, so you can focus on analysis, not busywork. Start building better reports today with Rankdigger.