


Digital Marketing Performance Metrics: Complete Guide
Sections
- Understanding Digital Marketing Performance Metrics
- Core Engagement And Conversion Metrics That Matter
- Traffic And Acquisition Metrics For Growth
- Content Marketing Performance Measurement
- Revenue-Focused Performance Indicators
- Attribution, Privacy, And Measurement In 2026
- SEO And SEM Performance Tracking
- Social, Video, Email, And Retention Metrics
- Building Your Performance Measurement Framework
- Common Beginner Mistakes
- The Beginner-Friendly KPI Stack
- Final Takeaway
#Understanding Digital Marketing Performance Metrics
Digital marketing performance metrics show whether your marketing is helping the business grow.
That is the most important point.
Not every number matters. A campaign can get thousands of clicks, likes, or impressions and still lose money. A website can get more traffic and still generate fewer leads. A social media post can go viral without bringing in a single customer.
So in 2026, the best way to measure marketing is simple:
Start with business outcomes first, then work backward.
That means your most important metrics should answer questions like:
- Are we getting more qualified leads?
- Are we acquiring customers profitably?
- Which channels create real revenue?
- Which campaigns help people move closer to buying?
- Which content brings valuable traffic, not just more traffic?
Digital advertising is still growing fast. Dentsu forecasts that digital advertising will represent 68.7% of total ad investment in 2026, with retail media, online video, social, and programmatic advertising continuing to grow strongly.
But more spending also means more waste if you track the wrong numbers.
#The 2026 Rule: Measure Decisions, Not Just Activity
A good metric should help you make a decision.
For example:
- Conversion rate tells you whether visitors are taking the action you want.
- Customer acquisition cost (CAC) tells you whether your growth is affordable.
- Customer lifetime value (CLV) tells you how much a customer may be worth over time.
- Return on ad spend (ROAS) tells you whether paid campaigns are generating revenue.
- Lead quality tells you whether your marketing attracts the right people.
A weak metric only tells you that something happened.
For example:
- Page views happened.
- Impressions happened.
- Likes happened.
- Followers increased.
- An email was opened.
These numbers can be useful, but they should not be the main success metric unless they connect to a real business goal.
#From Vanity Metrics to Actionable Insights
One of the biggest beginner mistakes is focusing on vanity metrics.
Vanity metrics look impressive but do not prove business value.
Imagine a company celebrating 100,000 social media followers. That sounds great. But if those followers never click, never sign up, never request a demo, and never buy, the number does not mean much.
A better question would be:
How many qualified leads or customers came from social media?
That is the difference between looking popular and growing the business.
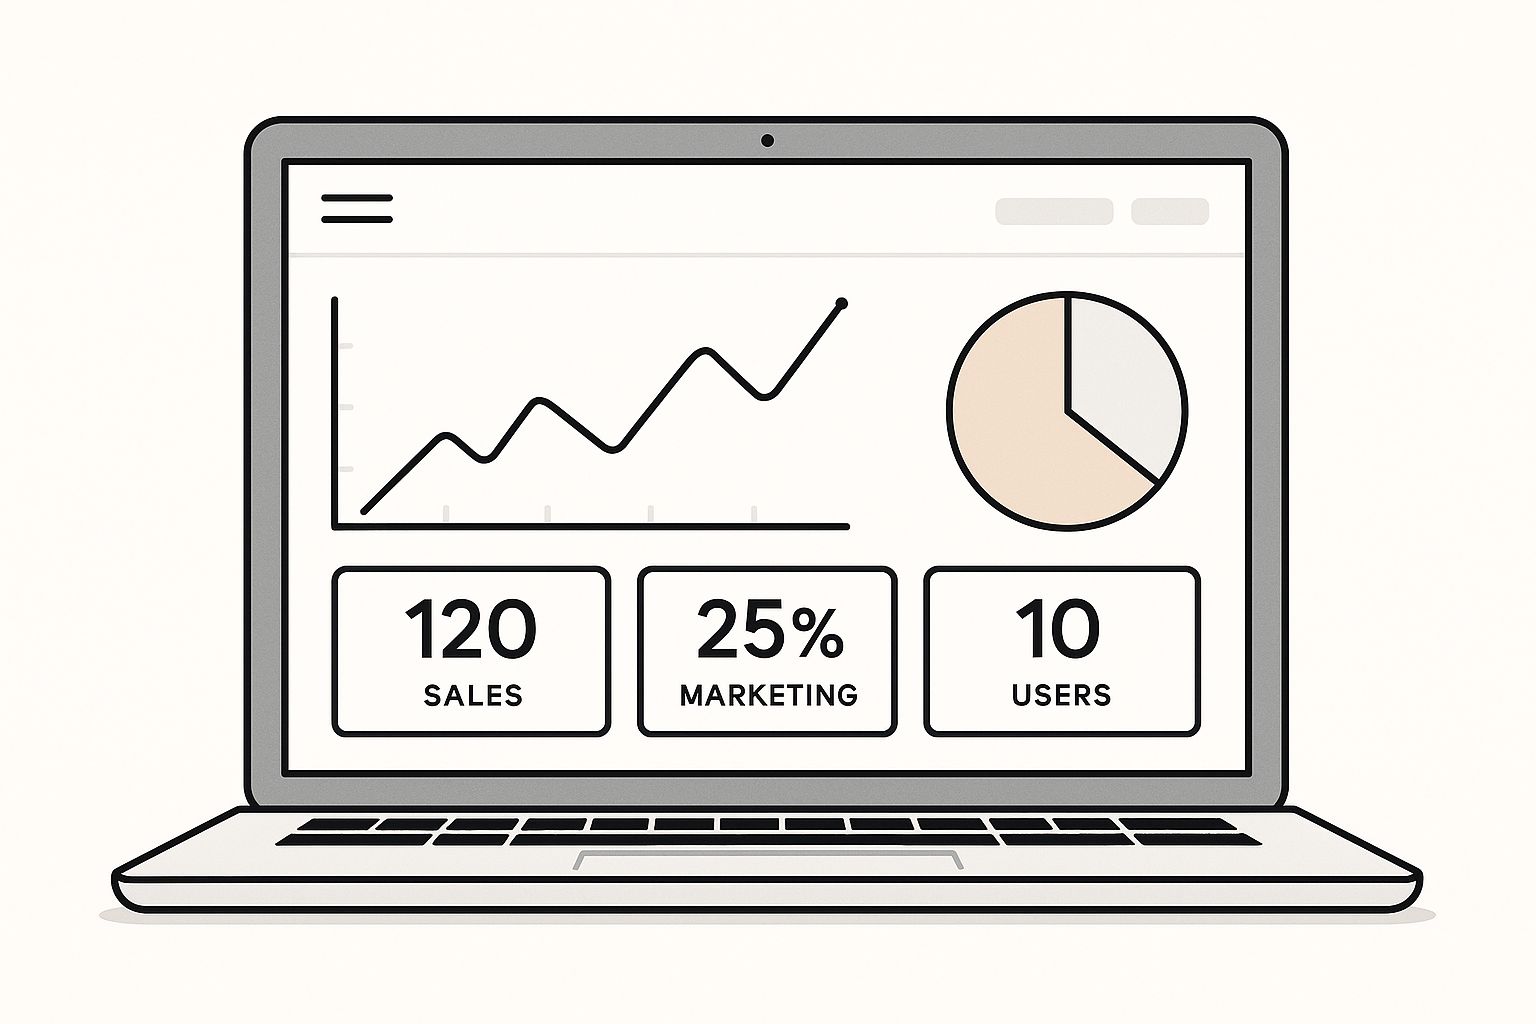
A well-designed dashboard helps you cut through the noise and focus on what truly drives performance.
This kind of visual overview should highlight the numbers that matter most: conversions, revenue, acquisition cost, channel quality, and customer value.
#The Goal: Strategic Measurement, Not Metric Obsession
The goal is not to track everything.
That usually creates confusion.
The goal is to track the few metrics that help you improve your marketing.
Before choosing metrics, ask:
- What is the goal of this campaign?
- What action do we want people to take?
- What metric proves that action happened?
- How much did it cost to create that result?
- What should we change based on the data?
For a beginner, this is the simplest framework:
- Awareness: Are people discovering us?
- Engagement: Are the right people paying attention?
- Conversion: Are people taking meaningful action?
- Revenue: Are those actions creating business value?
- Retention: Are customers staying, buying again, or becoming more valuable?
That is the foundation of modern digital marketing measurement.
#Core Engagement And Conversion Metrics That Matter
Traffic is only the beginning.
Think of your website like a store. Getting people through the door matters, but it does not guarantee sales. You also need to know what visitors do after they arrive.
Do they read? Do they click? Do they scroll? Do they sign up? Do they buy?
That is where engagement and conversion metrics become important.
Good engagement metrics help you understand whether visitors find your content useful. Good conversion metrics show whether that attention turns into action.
#Key Engagement Metrics To Monitor
Engagement metrics are useful because they show whether people care about what they found.
The most useful engagement metrics are:
- Engagement rate: In GA4, this helps show whether users had a meaningful visit instead of leaving immediately.
- Average engagement time: This shows how long your website or app was actively in use.
- Pages or screens per session: This shows whether people explore more than one page.
- Scroll depth: This shows how far people read on important pages.
- Video completion rate: This shows whether people actually watch your videos.
- Click-through rate (CTR): This shows whether your headline, ad, email, or search result motivates people to click.
These numbers are useful, but they are still not the final goal.
A person can read a blog post for five minutes and still do nothing.
That is why engagement metrics should be treated as signals, not proof of success.
#The Most Important Conversion Metrics
A conversion is an important action.
In ecommerce, that could be a purchase.
In B2B marketing, it could be a demo request, contact form submission, booked call, trial signup, or qualified lead.
In Google Analytics 4, important actions are now commonly handled as key events. If an event is important to your business, you can mark it as a key event in GA4. If that action is also used for ad optimization, it can be created as a conversion for Google Ads.
For beginners, this distinction matters:
- Event: Something a user does, like clicking a button.
- Key event: An important action in GA4, like submitting a lead form.
- Conversion: An important action used for advertising and optimization, especially in Google Ads.
The most important conversion metrics are:
- Conversion rate: The percentage of users who complete the desired action.
- Cost per conversion: How much you spend to generate one conversion.
- Lead-to-customer rate: How many leads become paying customers.
- Checkout completion rate: How many shoppers finish checkout.
- Form completion rate: How many people start and submit a form.
- Trial-to-paid conversion rate: How many trial users become paying customers.
#Micro-Conversions vs. Macro-Conversions
Not every conversion has the same value.
A micro-conversion is a smaller action that shows interest.
Examples:
- Newsletter signup
- PDF download
- Product page view
- Pricing page visit
- Video watched
- Account created
A macro-conversion is the main business goal.
Examples:
- Purchase
- Demo request
- Paid subscription
- Sales call booked
- Contract signed
Both matter.
Micro-conversions help you understand the customer journey. Macro-conversions show whether marketing is creating business results.
A strong measurement setup tracks both.
#Traffic And Acquisition Metrics For Growth
Traffic metrics tell you where your visitors come from.
This matters because not all traffic has the same value.
One channel might bring many visitors who never buy. Another channel might bring fewer visitors but more customers. The second channel may be more valuable.
That is why you should not only ask:
How much traffic did we get?
You should ask:
Which traffic source brings the best customers?
A dashboard, like the one you can find in Google Analytics, can break down traffic by channel, source, medium, campaign, device, and landing page.

This helps you see which channels bring visitors, engaged users, leads, and revenue.
#Key Traffic and Acquisition Metrics
The most useful acquisition metrics are:
- Users: How many people visited your site or app.
- New users: How many people discovered you for the first time.
- Traffic by channel: Where visitors came from, such as organic search, paid search, paid social, email, referral, direct, or AI search.
- Landing page performance: Which first pages bring valuable visits.
- Customer acquisition cost (CAC): How much it costs to acquire one new customer.
- Conversion rate by channel: Which channels turn visitors into leads or buyers.
- Revenue by channel: Which channels generate sales.
- Lead quality by channel: Which sources create leads that your sales team actually wants.
#Customer Acquisition Cost
Customer acquisition cost is one of the most important growth metrics.
The basic formula is:
CAC = Total sales and marketing cost / Number of new customers
For example:
If you spend $10,000 on sales and marketing in a month and acquire 100 new customers, your CAC is $100.
That number becomes useful when you compare it with customer value.
If your average customer is worth $500, a $100 CAC may be healthy.
If your average customer is worth $80, a $100 CAC is a problem.
#New vs. Returning Visitors
New visitors show whether your reach is growing.
Returning visitors show whether people remember you and come back.
Both are useful.
A healthy website usually needs a mix of both:
- New visitors for growth.
- Returning visitors for trust, consideration, and repeat engagement.
For ecommerce, returning visitors often convert better because they already know the brand.
For B2B, returning visits can show that a person is researching carefully before contacting sales.
#AI Search Traffic Is Now Part Of Acquisition
In 2026, traffic no longer comes only from traditional search engines, social platforms, and ads.
Some visitors now come from AI tools and AI-powered search experiences.
This can include:
- Google AI Overviews
- ChatGPT
- Perplexity
- Gemini
- Claude
- Copilot
- Other AI assistants
This traffic may still be small for many websites, but it can be valuable.
Track it separately where possible. Look for referral traffic from AI tools, brand mentions in AI answers, and pages that receive traffic after being cited or summarized.
The important beginner lesson is this:
Ranking in search is no longer the only visibility metric. Being mentioned, cited, or recommended by AI systems is becoming part of digital marketing performance.
#Content Marketing Performance Measurement
Content marketing is not just about publishing blog posts.
Good content helps people understand a problem, trust your brand, compare options, and take action.
That means you should measure content based on what role it plays in the customer journey.
A beginner-friendly way to think about content is:
- Some content attracts new people.
- Some content builds trust.
- Some content helps people decide.
- Some content supports sales.
- Some content keeps customers successful after they buy.
Each type of content needs different metrics.
#Top-of-Funnel Content Metrics
Top-of-funnel content is for awareness.
Examples:
- Beginner guides
- Educational blog posts
- Social media posts
- YouTube videos
- Glossaries
- Industry explainers
Useful metrics:
- Organic impressions
- Organic clicks
- New users
- Social reach
- Video views
- AI search visibility
- Newsletter signups
- Branded search growth
At this stage, do not expect every visitor to buy immediately.
The goal is to reach the right people and create the first useful interaction.
#Middle-of-Funnel Content Metrics
Middle-of-funnel content is for consideration.
Examples:
- Comparison pages
- Case studies
- Webinars
- Whitepapers
- Email sequences
- Product explainers
- Use-case pages
Useful metrics:
- Time on page
- Scroll depth
- Returning visitors
- Content downloads
- Webinar registrations
- Email engagement
- Pricing page visits after reading
- Assisted conversions
At this stage, people are evaluating whether your solution is relevant.
#Bottom-of-Funnel Content Metrics
Bottom-of-funnel content is close to the buying decision.
Examples:
- Pricing pages
- Demo pages
- Product pages
- Testimonials
- Sales enablement pages
- Alternative pages
- Buyer guides
Useful metrics:
- Demo requests
- Trial signups
- Purchases
- Lead-to-customer rate
- Sales-qualified leads
- Revenue influenced
- Conversion rate by page
- Pipeline generated
This is where content connects most clearly to revenue.
#Content-Assisted Conversions
Many people do not buy after reading one article.
They may:
- Read a beginner guide.
- Return later through Google.
- Watch a video.
- Click a retargeting ad.
- Visit the pricing page.
- Request a demo.
If you only credit the last click, the beginner guide looks worthless.
That is why content-assisted conversions matter.
They show whether content helped somewhere along the path, even if it was not the final click before conversion.
This is especially important in B2B, SaaS, high-ticket ecommerce, and any business with a long decision cycle.
#Revenue-Focused Performance Indicators
Revenue-focused metrics are the most important metrics for serious marketing decisions.
They answer one simple question:
Is marketing helping the business make money profitably?
Traffic, engagement, and leads matter. But if they do not connect to revenue, they can be misleading.
#The Most Important Revenue Metrics
The core revenue-focused metrics are:
- Revenue: Total money generated from customers.
- Marketing-sourced revenue: Revenue from customers whose first known touchpoint came from marketing.
- Marketing-influenced revenue: Revenue from customers who interacted with marketing before buying.
- ROAS: Revenue generated for every dollar spent on ads.
- CAC: Cost to acquire a customer.
- CLV: Estimated lifetime value of a customer.
- Payback period: How long it takes to recover your acquisition cost.
- Average order value (AOV): Average revenue per order.
- Retention rate: How many customers stay over time.
- Churn rate: How many customers leave.
#Return on Ad Spend
Return on ad spend shows how much revenue you generate from advertising.
The simple formula is:
ROAS = Revenue from ads / Cost of ads
Example:
If you spend $1,000 on ads and generate $5,000 in revenue, your ROAS is 5:1.
That means every $1 in ad spend generated $5 in revenue.
But ROAS has a weakness.
It does not always include profit margins, refunds, tools, agency costs, or sales team costs.
So ROAS is useful, but it should not be the only metric.
#Customer Lifetime Value
Customer lifetime value estimates how much revenue one customer brings over the full relationship.
This matters because not all customers are equal.
One campaign might bring cheap customers who leave quickly. Another campaign might bring expensive customers who stay for years.
The second campaign may be better.
A simple CLV formula is:
CLV = Average order value × Purchase frequency × Customer lifespan
For SaaS, you might calculate it differently:
CLV = Average monthly revenue per customer × Average customer lifetime
The exact formula depends on your business model.
The important point is simple:
Do not judge marketing only by the first purchase if customers can buy again or stay subscribed.
#CAC to CLV Ratio
One of the best beginner-friendly profitability checks is the CLV:CAC ratio.
Example:
If your CAC is $100 and your CLV is $300, your CLV:CAC ratio is 3:1.
That means a customer is worth three times what it costs to acquire them.
Many businesses aim for a healthy gap between acquisition cost and customer value, but the ideal ratio depends on your margins, growth stage, and business model.
#Payback Period
Payback period tells you how long it takes to earn back your acquisition cost.
Example:
If it costs $300 to acquire a customer and that customer pays $100 per month, the payback period is about 3 months, before considering costs and margin.
This is especially important for subscription businesses.
A campaign can look profitable based on lifetime value but still create cash flow problems if it takes too long to recover the money spent.
#Attribution, Privacy, And Measurement In 2026
Marketing measurement became more difficult because of privacy rules, cookie restrictions, ad blockers, tracking prevention, and longer customer journeys.
That does not mean measurement is dead.
It means marketers need better measurement habits.
In 2026, strong measurement usually includes:
- First-party data
- Consent-aware tracking
- GA4 key events
- Server-side or cleaner tagging setups where useful
- Enhanced conversions for ads
- CRM and offline conversion imports
- Attribution reports
- Incrementality testing
- Clear naming conventions
- Regular data quality checks
#First-Party Data Is Now Essential
First-party data is data you collect directly from your own audience and customers.
Examples:
- Website behavior
- Email signups
- Purchases
- CRM data
- Customer preferences
- App usage
- Support interactions
- Lead form submissions
This data is more reliable than rented third-party data because it comes from your own relationship with the customer.
For beginners, the best first-party data setup starts with:
- A clear cookie consent banner where required.
- GA4 installed correctly.
- Important actions marked as key events.
- A CRM that stores lead source and customer status.
- UTM parameters for campaigns.
- Email signup and customer data handled responsibly.
- Regular checks to make sure forms, purchases, and calls are tracked.
#Consent Mode And Privacy-Friendly Tracking
Google Consent Mode lets your website communicate a user’s consent choices to Google tags. It does not replace a cookie banner. Instead, it works with your consent setup so tags can adjust behavior based on what the user accepted.
This matters because many businesses operate in regions with strict privacy requirements.
Beginner-friendly rule:
Do not treat tracking as more important than consent. Build measurement around user choice.
A privacy-friendly setup should:
- Ask for consent where required.
- Respect the user’s choice.
- Avoid collecting unnecessary personal data.
- Use aggregated reporting where possible.
- Keep analytics access limited to the right people.
- Document what you track and why.
#Enhanced Conversions And Offline Conversions
For paid ads, platforms increasingly rely on improved conversion signals.
Google Ads enhanced conversions can use hashed first-party customer data to improve conversion measurement and bidding accuracy. In 2026, Google is also moving toward more unified enhanced conversion settings and updated offline conversion import workflows.
For beginners, this means:
If you run paid ads and generate leads or sales outside the website, connect your ad platform, analytics, and CRM as cleanly as possible.
Examples of offline conversions:
- A lead becomes a customer after a sales call.
- A form submission later turns into a signed contract.
- A phone call results in a sale.
- A store visit becomes a purchase.
Without offline conversion tracking, ad platforms may optimize for cheap leads instead of real customers.
#Attribution Models
Attribution means deciding which marketing touchpoints get credit for a conversion.
A customer journey might look like this:
- The person finds your blog through Google.
- They join your newsletter.
- They click a LinkedIn ad.
- They return through branded search.
- They request a demo.
If you only use last-click attribution, the final branded search gets all the credit.
But the blog, email, and LinkedIn ad also helped.
GA4 uses data-driven attribution by default for key events where enough data is available. Data-driven attribution uses your account data to estimate how different touchpoints contribute to important actions.
For beginners, the key lesson is:
Do not blindly trust one attribution view. Use attribution as a guide, not absolute truth.
#Incrementality Testing
Attribution shows what happened along a tracked path.
Incrementality tries to answer a deeper question:
Would this conversion have happened anyway?
For example, a retargeting campaign may claim many conversions. But some of those people may have bought even without the ad.
Incrementality testing helps you understand the real lift caused by marketing.
Beginner-friendly examples:
- Pause a campaign in one region and compare results.
- Show ads to one audience group but not another.
- Test whether branded search ads add extra sales or mostly capture people already looking for you.
- Compare email recipients with a holdout group that does not receive the campaign.
Attribution is useful.
Incrementality is stronger when you need to prove real business impact.
#SEO And SEM Performance Tracking
SEO and SEM both help people find you through search.
SEO means earning visibility organically. SEM usually means paying for visibility through search ads.
A good strategy often uses both.
SEO builds long-term visibility. SEM can create faster results and help test which keywords convert.
If you’re just starting out, you can explore a beginner’s guide to search engine optimization to get comfortable with the core concepts before diving deeper.
#Key SEO Metrics For 2026
SEO measurement has changed because search results are changing.
Traditional rankings still matter, but they are no longer enough.
Important SEO metrics now include:
- Organic clicks: How many visits come from unpaid search.
- Organic impressions: How often your site appears in search results.
- Click-through rate: How often searchers click your result.
- Keyword rankings: Where your pages rank for important queries.
- Search intent match: Whether your content satisfies what the searcher wants.
- Indexed pages: Whether search engines can find and index your pages.
- Technical health: Whether your site is crawlable, fast, and usable.
- Backlink quality: Whether trusted websites link to your content.
- Organic conversions: Leads, sales, or signups from organic search.
- AI search visibility: Whether your brand or content appears in AI-generated answers.
#AI Overviews And AI Search Visibility
AI-generated search results are now part of SEO measurement.
Recent research on Google AI Overviews found that AI Overviews appeared for a meaningful share of queries, especially question-style searches. The same research also found that some cited sources did not appear in the traditional first-page organic results.
That means SEO is no longer only about ranking in the classic blue links.
You also need to ask:
- Is our brand mentioned in AI answers?
- Are our pages cited as sources?
- Do AI summaries reduce clicks for some informational queries?
- Which topics still bring traffic?
- Which topics build visibility even without a click?
- Are our pages clear, factual, and easy for search engines and AI systems to understand?
For beginners, the practical takeaway is simple:
Create content that is clear, helpful, specific, and trustworthy.
Avoid thin copy that only repeats what every other article says.
#Key SEM Metrics For Paid Search
Paid search metrics focus on efficiency and profitability.
Important SEM metrics include:
- Impressions: How often your ad appears.
- Click-through rate: How often people click the ad.
- Cost per click: How much each click costs.
- Conversion rate: How often clicks become valuable actions.
- Cost per conversion: How much one lead, sale, or signup costs.
- ROAS: Revenue compared with ad spend.
- Search terms: The actual queries that triggered your ads.
- Quality Score or ad relevance signals: How relevant your ads and landing pages are.
- Impression share: How much available visibility your ads capture.
- Budget lost due to rank or budget: Whether you are missing opportunities.
#Do Not Optimize Paid Ads For Cheap Leads Only
This is a common mistake.
A campaign with cheap leads is not always a good campaign.
If those leads do not become customers, the campaign is wasting money.
A better paid search setup tracks:
- Lead submitted
- Lead qualified
- Sales call booked
- Opportunity created
- Customer won
- Revenue generated
This helps ad platforms optimize toward business value instead of shallow conversions.
#Social, Video, Email, And Retention Metrics
Digital marketing is not only search and ads.
Many businesses also rely on social media, video, email, communities, and customer retention.
Each channel needs its own metrics, but the same rule applies:
Measure the action that matters, not just the activity that looks good.
#Social Media Metrics
Social media can support awareness, trust, community, and sales.
Useful social metrics include:
- Reach
- Engagement rate
- Shares
- Saves
- Profile visits
- Link clicks
- Follower growth quality
- Leads from social
- Sales from social
- Assisted conversions
For many brands, saves and shares are stronger signals than likes because they suggest the content was useful enough to keep or pass along.
But the best social metric depends on the goal.
If the goal is awareness, reach matters.
If the goal is traffic, link clicks matter.
If the goal is revenue, conversions and sales matter.
#Video Metrics
Video is important across social, YouTube, ads, landing pages, and product education.
Useful video metrics include:
- Watch time
- Average view duration
- Completion rate
- Retention curve
- Click-through rate
- Subscribers gained
- Leads or sales after watching
- Cost per completed view for ads
For beginners, completion rate is especially useful.
If many people leave in the first few seconds, the hook may be weak.
If people watch most of the video but do not click, the call to action may need improvement.
#Email Marketing Metrics
Email is still one of the most valuable owned channels because you are not fully dependent on an algorithm.
Useful email metrics include:
- Delivery rate
- Open rate
- Click-through rate
- Unsubscribe rate
- Spam complaint rate
- Conversion rate
- Revenue per email
- List growth
- Segmented campaign performance
Open rate is less reliable than it used to be because of privacy features and automated opens.
So do not judge email success only by opens.
Clicks, conversions, replies, and revenue are usually more useful.
#Retention Metrics
Retention is often more profitable than acquisition.
If customers stay longer, buy again, or upgrade, your marketing becomes more efficient.
Useful retention metrics include:
- Repeat purchase rate
- Churn rate
- Retention rate
- Subscription renewal rate
- Expansion revenue
- Customer lifetime value
- Net revenue retention
- Customer satisfaction
- Referral rate
For beginners, this is the key idea:
Marketing does not end when someone buys.
Good onboarding, email education, product content, and customer communication can increase lifetime value.
#Building Your Performance Measurement Framework
A performance measurement framework is your plan for deciding what to track, where to track it, and how to use the data.
Without a framework, marketing reports become messy.
One person looks at ad clicks. Another looks at GA4 users. Another looks at CRM leads. Another looks at revenue. Nobody agrees on what is working.
A good framework creates one shared view.
#Step 1: Define The Business Goal
Start with the business goal.
Examples:
- Increase ecommerce revenue.
- Generate qualified B2B leads.
- Grow newsletter subscribers.
- Reduce acquisition cost.
- Increase demo bookings.
- Improve customer retention.
- Launch a new product.
- Grow brand awareness in a new market.
Do not start with the tool.
Start with the goal.
#Step 2: Choose One Main KPI
Each campaign should have one main KPI.
Examples:
- Ecommerce campaign: purchases or revenue.
- Lead generation campaign: qualified leads.
- SaaS campaign: trial signups or paid subscriptions.
- Awareness campaign: reach among the right audience.
- Content campaign: organic conversions or assisted conversions.
- Email campaign: revenue per recipient or booked calls.
Supporting metrics are useful, but one main KPI keeps everyone focused.
#Step 3: Track Supporting Metrics
Supporting metrics explain why the main KPI changed.
For example, if conversions dropped, you might check:
- Traffic quality
- Landing page conversion rate
- Form errors
- Page speed
- Ad targeting
- Cost per click
- Search intent
- Device performance
- Checkout problems
Supporting metrics help you diagnose the problem.
#Step 4: Set Up Clean Tracking
A beginner-friendly tracking setup should include:
- GA4 installed correctly.
- Important actions marked as key events.
- Google Ads and GA4 linked where relevant.
- Campaign URLs tagged with UTMs.
- Consent mode configured where needed.
- CRM connected to lead sources.
- Ecommerce tracking configured if you sell online.
- Form submissions tested.
- Thank-you pages or event tracking verified.
- Internal traffic filtered or separated.
- A simple dashboard for weekly review.
#Step 5: Use Clear UTM Naming
UTM parameters help you identify where campaign traffic came from.
A simple UTM structure might include:
- utm_source: google, newsletter, linkedin, facebook
- utm_medium: cpc, email, organic_social, paid_social
- utm_campaign: spring_sale, product_launch, webinar_june
- utm_content: video_ad_1, image_ad_2, cta_button
Keep names lowercase and consistent.
Bad naming creates messy reports.
For example, these may appear as separate sources:
- FB
- Meta
- meta.com
Choose one naming system and document it.
#Step 6: Build A Simple Dashboard
Avoid dashboards with too many charts.
A beginner-friendly dashboard should show:
- Revenue or leads
- Conversions
- Conversion rate
- CAC or cost per conversion
- ROAS if you run ads
- Traffic by channel
- Top landing pages
- Best and worst campaigns
- Lead quality or customer quality
- Data quality warnings
The dashboard should help you answer:
What happened, why did it happen, and what should we do next?
#Step 7: Review Metrics Regularly
Different metrics need different review cycles.
Daily:
- Ad spend
- Major tracking issues
- Campaign errors
- Website outages
Weekly:
- Leads
- Revenue
- Conversions
- Cost per conversion
- Channel performance
- Landing page performance
Monthly:
- CAC
- CLV
- ROAS
- SEO performance
- Content performance
- Email performance
- Attribution insights
Quarterly:
- Budget allocation
- Channel strategy
- Customer quality
- Incrementality tests
- Market positioning
- Long-term growth trends
#Common Beginner Mistakes
Many marketing measurement problems come from the same mistakes.
#Mistake 1: Tracking Too Much
More data does not always mean better decisions.
Start with a small number of important KPIs.
Add more only when you know how you will use them.
#Mistake 2: Trusting Platform Numbers Blindly
Google Ads, Meta Ads, TikTok Ads, GA4, Shopify, HubSpot, and your CRM may all report different numbers.
That does not always mean one tool is broken.
They may use different attribution windows, definitions, time zones, or counting methods.
Use one primary reporting source for business decisions where possible.
#Mistake 3: Ignoring Lead Quality
A campaign can generate many leads and still fail.
Track what happens after the lead arrives.
Did sales accept it? Did the person book a call? Did they become a customer? How much revenue did they create?
#Mistake 4: Measuring Only Last Click
Last-click attribution is easy to understand, but it often undervalues content, social, video, email, and brand-building.
Use attribution reports, assisted conversions, and incrementality tests for a fuller view.
#Mistake 5: Forgetting Privacy And Consent
Modern measurement must respect user choices.
Do not build a tracking setup that depends on collecting everything from everyone.
Use consent-aware, privacy-friendly, first-party measurement.
#Mistake 6: Optimizing Before You Have Enough Data
Beginners often change campaigns too quickly.
If you make decisions from tiny data samples, you may react to noise instead of real patterns.
Wait until you have enough data to see a meaningful signal.
#The Beginner-Friendly KPI Stack
If you are new to digital marketing metrics, start with this simple KPI stack.
#For Any Website
Track:
- Users
- Traffic by channel
- Engagement rate
- Key events
- Conversion rate
- Top landing pages
- Leads or sales
#For Ecommerce
Track:
- Revenue
- Purchases
- Conversion rate
- Average order value
- Cart abandonment
- Checkout completion rate
- ROAS
- CAC
- Repeat purchase rate
#For B2B Lead Generation
Track:
- Form submissions
- Demo requests
- Cost per lead
- Qualified lead rate
- Sales-qualified leads
- Opportunity creation
- Customer acquisition cost
- Pipeline generated
- Revenue won
#For Content Marketing
Track:
- Organic traffic
- New users
- Engagement time
- Scroll depth
- Newsletter signups
- Assisted conversions
- Leads from content
- AI search visibility
- Revenue influenced
#For Paid Ads
Track:
- Spend
- Impressions
- Click-through rate
- Cost per click
- Conversion rate
- Cost per conversion
- ROAS
- Lead quality
- Revenue
- Incremental lift where possible
#Final Takeaway
Digital marketing performance metrics are not about collecting as many numbers as possible.
They are about making better decisions.
In 2026, the strongest marketing teams focus on:
- Business outcomes first.
- Clean conversion tracking.
- First-party data.
- Privacy-friendly measurement.
- Revenue and customer quality.
- AI search visibility.
- Attribution plus incrementality.
- Simple dashboards that support action.
The best beginner advice is this:
Do not ask, “Which metric looks good?” Ask, “Which metric helps us make a better decision?”
That mindset turns marketing data from a confusing report into a practical growth tool.
To dig deeper into your website’s performance and uncover high-potential keywords, check out the powerful analytics tools available at Rankdigger.