How to Analyze Log Files for Better SEO Performance
Sections
To really get a grip on log file analysis, you have to see the logs for what they are: the unfiltered, moment-by-moment record of every single interaction with your web server. This raw data, logged by services like Apache or NGINX, shows you exactly how search engine bots and real users access your site. It’s full of critical insights you just can’t see in standard analytics tools.
#What Log File Analysis Reveals About Your SEO

Let’s be honest, server logs usually sound like a developer’s headache, not an SEO’s secret weapon. But what if they held the unfiltered truth about how Google actually sees your website? That’s exactly what they are. Log files are the server’s diary, recording every request made - whether it’s from a person browsing or a crawler like Googlebot.
This raw data is a goldmine. It tells a completely different story than what your crawling tools or even Google Search Console might show you. While those tools are absolutely essential, they give you an outside-in perspective. Log files deliver the ground truth, straight from the source. Our guide on how to use Google Search Console can help you combine these data sources for maximum effect.
#The Value of Unfiltered Data
The need to manage this kind of data is exploding. In fact, the global log file summarization market is projected to hit USD 6.34 billion by 2033, mainly because of the growing need for better security and operational intelligence. This just shows how valuable this raw info has become. You can dig into more details in the log market report.
For SEOs, this translates into real-world advantages that shift your strategy from just reacting to being powerfully proactive.
-
Crawl Budget Optimization: You can pinpoint exactly where Googlebot is spending its time. Are crawlers getting lost in low-value parameterized URLs or hitting thousands of 404s? Log files give you the hard evidence to block wasteful crawling and point that budget toward your money pages.
-
True Crawl Frequency: See which pages and directories Googlebot considers most important based on how often it comes back to recrawl them. You might be surprised to find it loves a section of your site you’ve been completely ignoring.
-
Technical Error Diagnosis: Spot critical issues that other tools often miss, like intermittent server errors (5xx codes) or weird redirect loops that only seem to affect crawlers.
By analyzing log files, you shift from guessing how Google crawls your site to knowing precisely what it’s doing. This direct evidence allows you to make data-driven decisions that can significantly improve indexing and rankings.
#How to Access Your Server Log Files

Alright, before you can dive in and start finding SEO gold, you need to actually get your hands on the log files. This first step can feel like a hurdle, but it’s usually more straightforward than you might think.
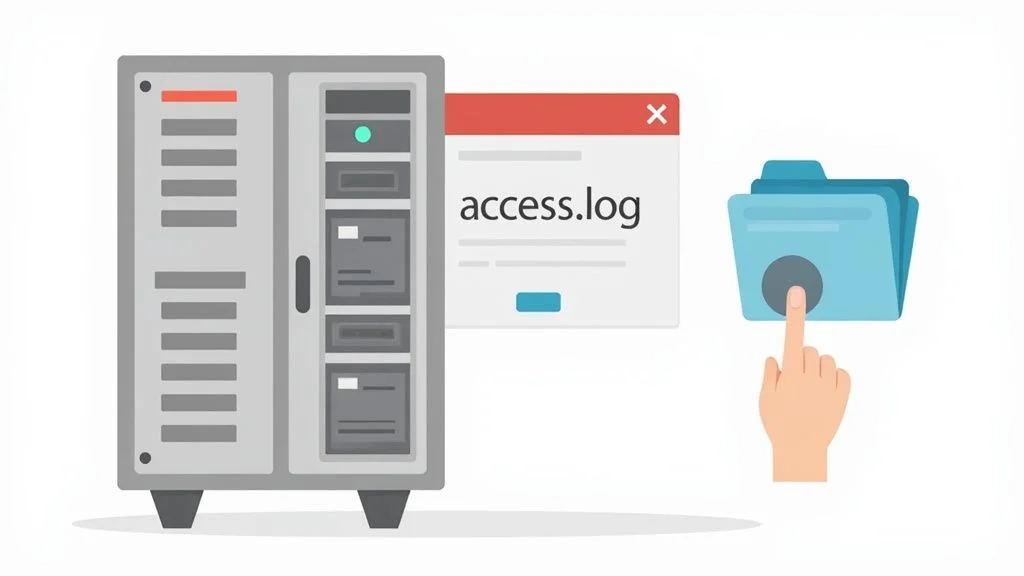
Your goal is to grab the raw server logs. On most web servers, these are tucked away in a directory called /var/log/. How you get to them really depends on your hosting setup and what kind of access you have.
#Finding Logs in Common Hosting Environments
If you’re using a standard web host with a control panel, your life is pretty easy here. Most of these providers give you a direct way to download logs through the same graphical interface you already use.
-
cPanel: This is probably the most common one out there. Just look for an icon labeled “Raw Access” or “Logs.” From there, you can usually download archived (.gz) log files right to your computer.
-
Plesk: Plesk is similar. You’ll want to poke around in a “Logs” or “Files” section to find and download your server’s access logs.
These control panels are built for convenience, making them the best place to start. If you don’t spot these options, a quick search through your host’s help docs or firing off a support ticket is your next best bet.
#Using FTP or SFTP Clients
For those of us with direct server access, a good old FTP (File Transfer Protocol) or SFTP (Secure File Transfer Protocol) client is your best friend. Tools like FileZilla or Cyberduck let you connect right into your server’s file system and navigate to the log directory.
Once you’re connected, you’ll typically find your access logs in a path like /var/log/apache2/ for Apache servers or /var/log/nginx/ for NGINX. The file you’re hunting for is usually called access.log.
When you’re talking to a hosting provider or your IT team, be specific. Ask for the “raw server access logs in Combined Log Format” for the last 30 days. That little bit of clarity saves a ton of back-and-forth and makes sure you get exactly what you need.
#Advanced Access and Modern Alternatives
If you’re more comfortable on the command line, SSH (Secure Shell) access is the most direct route. It lets you find, compress, and download logs straight from the server, but it does require a bit more technical know-how.
Beyond grabbing the log files themselves, it’s also worth exploring modern server-side tracking techniques. These can open up even richer data streams, giving you another layer of insight into what’s happening on your server.
No matter which method you use, always ask for a decent date range. A single day’s worth of data is rarely enough. You need at least a few weeks - but ideally a full month - to spot meaningful patterns in how search bots are interacting with your site over time.
#Choosing the Right Log Analysis Tools

Let’s be honest, staring at a raw log file with millions of lines of text is a one-way ticket to a massive headache. You need the right tool to cut through that chaos and turn it into something you can actually use. The right software transforms that wall of text into clear, actionable insights.
Your choice really boils down to your budget, how comfortable you are with technical tools, and what specific questions you’re trying to answer.
While the enterprise log management industry is a big deal, with major players like IBM and Sumo Logic building massive platforms, we SEOs usually don’t need that level of firepower. Our focus is much more specific. We’re looking for tools that help us see our sites through the eyes of a search engine bot.
Let’s break down the most common toolsets that get the job done for us.
#Dedicated SEO Log Analyzers
If you want to get straight to the good stuff without a lot of setup, a dedicated SEO log analyzer is your best bet. These tools are built from the ground up to interpret log data through an SEO lens, turning raw server hits into clear reports on crawl budget, bot behavior, and problematic status codes.
Here are a few of the go-to options:
-
Screaming Frog Log File Analyser: This is a classic for a reason. You just upload your log files, and it does the heavy lifting - identifying bots, verifying them, and even merging the data with a site crawl to instantly spot orphaned pages that Google is hitting but aren’t linked internally. It’s incredibly handy.
-
Semrush Log File Analyzer: For those already in the Semrush ecosystem, this is a super convenient option. It’s built into their Site Audit tool, letting you analyze log data right alongside all your other technical SEO reports. It’s great for visualizing Googlebot activity and seeing which parts of your site get the most (or least) attention.
-
JetOctopus: This one is a beast, especially for massive, enterprise-level sites. It’s a cloud-based crawler and log analyzer, meaning you can throw huge log files at it without slowing your own computer to a crawl.
These tools are designed to surface SEO-specific problems fast. You’re not just looking at data; you’re getting answers to questions like, “Is Googlebot wasting half its crawl budget on my faceted navigation?”
#Manual and Hybrid Approaches
What if you’re on a tight budget or just like to get your hands dirty? You don’t always need a pricey, specialized tool. Some familiar software can be surprisingly powerful for wrangling log files.
The most accessible option is probably Microsoft Excel with Power Query. Don’t underestimate it. Power Query is a data-crunching engine that lets you handle millions of rows without making Excel freeze up. You can use it to parse the log file into clean columns, filter for just Googlebot activity, and pivot the data to summarize hits by URL or status code. It’s a fantastic way to dig in without spending a dime on new software.
The real magic happens when you start blending data sources. Cross-referencing Googlebot hits from your logs with crawl data from a tool like our Lighthouse Crawler can uncover huge opportunities. You might find high-priority pages that are barely ever crawled, which is a massive red flag for an internal linking problem.
For those who are comfortable on the command line, simple tools like grep and awk are lightning-fast. A single command can instantly pull every line containing “Googlebot” or count all the 404 errors. It’s a great way to get quick answers to specific questions without a full-blown analysis.
#Comparison of Log File Analysis Tools for SEOs
Choosing the right tool can feel overwhelming, so I’ve put together a quick comparison of the most popular options to help you decide which one best fits your workflow and technical comfort level.
| Tool | Best For | Technical Skill Required | Cost | Key SEO Feature |
|---|---|---|---|---|
| **Screaming Frog** | Quick, desktop-based analysis for small to medium-sized sites. | Low | Paid (Annual) | Merges log data with crawl data to find orphaned pages and crawl discrepancies. |
| **Semrush** | SEOs already using the Semrush suite who want an integrated solution. | Low | Subscription | Visualizes crawl frequency and connects log insights to other site audit data. |
| **JetOctopus** | Large, enterprise-level websites with massive log files. | Medium | Subscription | Cloud-based processing handles huge datasets without using local resources. |
| **Excel with Power Query** | Budget-conscious SEOs who are comfortable with data manipulation. | Medium | Free (Included) | Highly flexible for custom analysis and combining with other data sources. |
| **Command Line (grep/awk)** | Quick filtering and data extraction on very large files. | High | Free | Extremely fast for answering specific questions (e.g., counting 404s). |
Ultimately, there’s no single “best” tool for everyone. The right choice is the one that empowers you to move from raw data to a clear action plan efficiently. Whether it’s a dedicated platform or a trusty spreadsheet, the goal is the same: find the insights and improve your site’s performance.
#Turning Log Data into Actionable SEO Insights

This is where the magic happens. After all the parsing and filtering, you get to translate those millions of server hits into a concrete SEO action plan. The insights you find here are the real deal - they often lead to the biggest performance jumps because they’re based on what Googlebot actually does, not just what we assume it does.
The whole game is about slicing the data in specific ways to answer critical SEO questions. You’re basically a detective, hunting for clues that expose crawl inefficiencies, hidden content opportunities, and technical roadblocks that your standard site crawlers would miss entirely.
And this isn’t just a niche trick anymore. The global log management market was valued at around USD 3.76 billion in 2025 and is expected to explode to USD 7.88 billion by 2030. That tells you how critical this kind of precise operational data has become.
#Isolate Googlebot to See What It Really Cares About
First thing’s first: you have to cut through the noise. Your server logs are a chaotic mix of hits from real users, Bingbot, random scrapers, and who-knows-what-else. To get anything useful for SEO, you have to filter for requests from verified Googlebot user agents only.
Once you’ve got a clean view of Googlebot’s activity, you can finally see your site through its eyes. Start asking questions:
-
Which folders get the most crawl love? You might be shocked to find Googlebot spending half its time on an old, forgotten blog subdirectory you haven’t touched in years.
-
How often are my money pages revisited? If your most important product pages are only getting crawled once a month, that’s a massive red flag. It probably signals an issue with internal linking or how important Google perceives them to be.
-
Are any key sections being completely ignored? Launched a new section of the site a month ago and it’s getting zero Googlebot hits? It almost certainly has a discoverability problem.
This first pass gives you a high-level map of Google’s priorities, and it often reveals a major disconnect between what you think is important and what Google actually crawls.
#Hunt Down Wasted Crawl Budget
Googlebot doesn’t have unlimited time. Every single second it spends crawling a useless URL is a second it’s not spending on a page that could be earning you traffic and cash. Your log files are the ultimate weapon for finding and plugging these leaks.
A great place to start is by filtering your Googlebot data by HTTP status codes. This will immediately show you the low-hanging fruit.
Look for a high volume of hits to pages returning a 404 (Not Found) status. These are dead ends that bleed your crawl budget dry. A few 404s here and there are normal, but if you see Googlebot repeatedly hitting thousands of them, you likely have a systemic problem like bad internal links or an outdated sitemap. If this is you, we have a guide on how to fix 404 errors that can help.
Also, keep a close eye on redirect chains (301 status codes). If you see Googlebot constantly hitting URLs that redirect - especially in multiple hops - you’re making it do extra work just to get to the final destination.
A classic crawl budget killer is faceted navigation. If every filter combination creates a unique, indexable URL, you might be forcing Googlebot to crawl millions of thin, duplicate pages. Logs will light this problem up like a Christmas tree.
#Uncover Orphaned Pages and Hidden Content
Here’s one of my favorite and most powerful techniques: cross-referencing your log file data with a standard site crawl from a tool like Screaming Frog. This is where you find the gold.
You’re primarily looking for orphaned pages. These are URLs that show up in your log files (meaning Googlebot is crawling them) but don’t appear in your site crawl (meaning they have no internal links pointing to them). These are often ghosts from old site structures or migrations, and they represent a huge opportunity. If Google is still finding them, they have some link equity - bringing them back into your site architecture with fresh internal links can give you a quick and easy win.
This process also helps you spot pages that are getting crawled but are never indexed or ranked. By comparing log hits against performance data, you can build a kill list of underperforming content that needs to be improved, consolidated, or just pruned altogether.
Ultimately, digging into your log files is a vital part of a broader strategy. It elevates your search engine marketing intelligence and allows you to make smarter, data-backed decisions across the board.
#Digging Deeper with Advanced Log Analysis Strategies
Alright, once you’ve got a handle on the basic filtering and sorting, it’s time to roll up your sleeves and get into the really interesting stuff. These next-level techniques are where you stop just checking logs and start performing deep, data-backed diagnostics on your site’s SEO health.
This is all about connecting the dots between your log data and other sources to build a complete, nuanced picture of what’s really happening.
#Isolate and Analyze Specific User-Agents
One of the most powerful moves you can make is to start dissecting the user-agent strings in your logs. This is how you tell different crawlers apart. You’re not just looking at “Googlebot” anymore; you’re isolating Googlebot’s mobile crawler from its desktop counterpart. This is non-negotiable for understanding your mobile-first indexing performance.
Once you separate them, you can start asking some very specific, high-impact questions:
-
Is Google’s mobile crawler hitting unique errors that the desktop bot never sees?
-
Is the mobile bot crawling my most important pages way less often than the desktop version?
-
Are there big differences in the status codes or response times served to each crawler?
The answers to these questions often uncover hidden technical issues that are throttling your mobile performance.
#Combine Data Sources for the Full Story
Log analysis on its own is powerful, but its true potential is unlocked when you start layering in data from other platforms. Your logs tell you what was crawled, but other tools can help you understand the why and the so what.
First up, cross-reference your log data with the Crawl Stats report in Google Search Console. Think of GSC as the high-level summary and your logs as the raw, undeniable proof. If GSC flags a spike in “Not found (404)” errors, that’s your cue. Dive into your logs to find the exact URLs Googlebot is hitting, how often it’s hitting them, and even what pages are referring the bot to those broken links.
Log files are the ground truth of bot activity. When you pair them with Google Search Console data, you can validate GSC’s reports and drill down into the specific URLs causing crawl problems. This turns a vague trend into a concrete to-do list.
Next, bring Google Analytics into the mix. This is where you can spot crawl budget waste. By comparing bot hits from your logs to actual user sessions in GA, you can quickly identify pages that are crawled relentlessly but get almost zero human traffic.
This is a massive red flag. It often points to low-quality, thin, or irrelevant content that’s just eating up your crawl budget without providing any real value to your audience or your bottom line.
#Find and Manage Unwanted Bot Traffic
Beyond the usual suspects from search engines, your logs will show you a whole ecosystem of other bots. Some are harmless, but many are aggressive scrapers, third-party tools, or just plain junk traffic that can drag down your server resources.
Keep an eye out for user agents you don’t recognize hitting your site with an unusually high frequency. This kind of unwanted traffic can actually slow your site down for real users and, more importantly, for search engine crawlers.
Once you’ve identified these resource hogs, you can block them by their IP address or user-agent string. A quick update to your .htaccess file or a firewall rule can preserve your server’s resources for the traffic that actually matters.
#Got Questions About SEO Log File Analysis?
Jumping into log files for the first time can feel like you’re staring at the Matrix. It’s totally normal to have a bunch of questions popping up. Let’s tackle the big ones that most SEOs have when they first get their hands dirty with logs.
Getting your head around these key points will give you the confidence to start your analysis with a clear game plan.
#How Often Should I Be Doing This?
For the vast majority of websites, a quarterly log file analysis is a great starting point. That rhythm is frequent enough to spot weird trends, catch new crawl problems, and see if your SEO work is actually paying off, all without it taking over your entire schedule.
But, of course, the real answer depends on your site.
-
If you’re running a large, dynamic site like an e-commerce giant or a news portal with constant updates, you’ll want to ramp that up to a monthly or even bi-weekly analysis. Things just change too fast to wait three months.
-
You should always run an analysis right after a major site event. Think website migrations, a complete redesign, or a massive content prune. This is your only way to know for sure if search bots are finding and crawling your new setup correctly from day one.
#Do I Need to Be a Developer to Analyze Logs?
Not at all. While knowing your way around the command line gives you some serious power and speed, it’s absolutely not a requirement for effective log analysis. These days, many of the best tools are built for SEOs, not hardcore developers, with interfaces you can actually make sense of.
The single most powerful insight you’ll get from log files is the unfiltered truth about your ‘crawl budget.’ This is the real story of how Google spends its resources on your site. Logs show you exactly where Googlebot is spending its time and, more importantly, where it’s getting lost and wasting crawls on junk URLs.
Tools like the Screaming Frog Log File Analyser, Semrush, or JetOctopus do all the heavy lifting for you. You just upload your log file, and boom - you get straight into reports on crawl budget, bot activity, and response codes without touching a single line of code.
#My Log Files Are Huge. What Do I Do?
Yeah, massive log files can bring most programs, especially Excel, to a grinding halt. The first thing you should always do is ask your hosting provider for a compressed version of the file, which usually comes as a .gz file. This makes the download and transfer way more manageable.
When it’s time to actually analyze it, your best bet is always a dedicated log analyzer tool. They’re built from the ground up to handle massive datasets without breaking a sweat. If you’re stuck using a spreadsheet, look into features like Power Query in Excel, which is designed to handle millions of rows without crashing.
For the truly gigantic sites, it’s often more practical to just analyze a sample of the data. Instead of trying to wrestle with a full year’s worth of logs, just focus on a recent week or month. You’ll still get timely, actionable insights without melting your computer.
At Rankdigger, we’re all about giving you the tools and clarity to turn complex data into straightforward SEO wins. Take a look at our platform to see how our advanced analytics can help you master everything from log file analysis to finding your next big keyword opportunity. Discover more at Rankdigger.

